Metal Detecting Research and Exploration - A Complete Guide, p.21
Understanding Topographic Maps
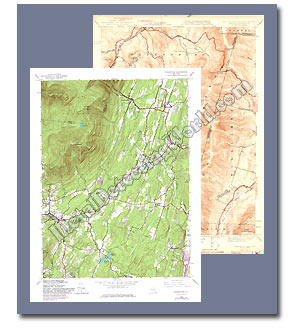
A topographic map is a detailed and accurate two-dimensional graphic representation of cultural and natural features on the ground. A topographic map is characterized by large-scale detail and quantitative representation of relief using contour lines.
Topo maps make it possible to determine coordinates, length, square, height and volume of objects shown on map. Topographic maps are used for a number of applications, from camping, hunting, fishing, and hiking to urban planning, resource management, surveying, and, of course, treasure hunting.
The use of contour lines is the most distinctive characteristic of a topographic map. Contours are imaginary lines that connect points of similar elevation and represent the three-dimensional relief of the Earth's surface. Contours make it possible to depict the height of mountains and steepness of slopes on a two-dimensional map surface.
Topo maps - also contour maps, topo quads or quadrangles, are distinguished from smaller-scale "chorographic maps" that cover large regions, "planimetric maps" that do not show elevations, and "thematic maps" that focus on specific topics.
The use of topographic maps requires a correct interpretation of the following: 1) Area Features (colored areas), 2) Lines, and 3) Symbols.
1) AREA FEATURES AND THEIR CONVENTIONAL COLORS
The first features usually noticed on a topographic map are the area features, such as vegetation, water, densely built-up areas and other. To ease the identification of these area features on a map, conventional colors are used. These colors may vary from map to map, but the use of them has not changed much over the past several hundred years. On a standard large-scale topographic map, each conventional color represents a certain area feature, its lines and symbols:
Blue identifies hydrography or water features such as lakes, marshes, swamps, rivers, creeks, drainage, and coastal waters.
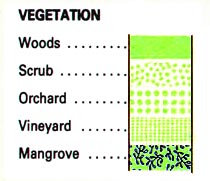
Green identifies vegetation such as woods, orchards, scrub, tropical grass, mangrove and marshy areas, tundra, and vineyards.
Brown identifies all relief features and elevation, such as contour lines, intermediate contour lines, form lines, and cultivated land on red-light readable maps. In addition to contour lines, there are relief symbols to show cuts, levees, sand, sand dunes, ice fields, strip mines, and glaciers.
Red classifies cultural features, such as populated areas, main roads, and boundaries, on older maps.
Red-Brown colors are combined to identify cultural features, all relief features, non-surveyed spot elevations, and elevation, such as contour lines on red-light readable maps.
Black indicates man-made features such as buildings and roads, railroads, surveyed spot elevations, and all labels.
Purple, at one time, was used as a revision color to show all feature changes. Currently, purple is not used, but purple features are still present on many existing maps.
Other colors occasionally may be used to show special information. These are indicated in the marginal information as a rule.
2) LINES CORRESPONDING TO AREA FEATURES
Many features on topo maps are shown by lines that may be straight, curved, solid, dashed, dotted, or in any combination. The lines are shown in a color corresponding to the type of feature: relief contours are brown; lakes, streams, irrigation ditches, and other hydrographic features are blue; land grids and important roads are red; and other roads and trails, railroads, boundaries, and other cultural features are black.
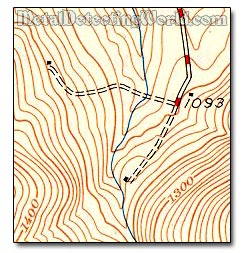
Relief contours are shown by lines of different widths. Each contour is a line of equal elevation; therefore, contours never cross. They show the general 3-dimensional shape of the terrain. To help the viewer observe and determine elevations, index contours are wider. Elevation values are printed in several places along these lines, i.e. every point on each marked line of 500 m elevation is 500 m above mean sea level. Benchmarks, represented by a black X, are points of elevation known with greater certainty.
The narrower intermediate and supplementary contours (portrayed as dotted lines, indicate 5-foot intervals in flat terrain) placed between the index contours are used to show more details of the relief. Contour lines that are very close together represent steep slopes. Widely spaced contour lines or an absence of them means that the ground slope is relatively level.
The elevation difference between adjacent contour lines - the contour interval, is selected to make the best representation of the terrain's general shape. A map of a relatively flat area may have a contour interval of 10 feet or less. Maps of mountainous areas may have contour intervals of 100 feet or more. The contour interval is usually printed in the margin of the map.
Bathymetric (relating to measurements of the depths of oceans, seas, or other large bodies of water) contours are shown in blue or black, depending on their location. They show the shape and slope of the ocean bottom surface. The bathymetric contour interval may vary on each map and is also explained in the map margin.